Search
Search
Learning path
Beginner
Intermediate
Advanced
Visual vocabulary
Intro
Deviation
Correlation
Ranking
Distribution
Change over time
Magnitude
Part-to-whole
Spatial
Flow
Core features
Marks
Area
Arrow
Auto
Axis
Bar
Bollinger
Box
Cell
Contour
Delaunay
Density
Difference
Dot
Frame
Geo
Grid
Hexgrid
Image
Line
Line-curves
Line-markers
Linear-regression
Link-markers
Link
Raster
Rect
Rule
Text
Tick
Tip
Tree
Vector
Waffle
Scales
X-axis
Y-axis
Color
Size
Opacity
Symbol
Length
Horizontal-facet
Vertical-facet
Formats
Intervals
Transforms
Bin
Centroid
Dodge
Filter
Group
Hexbin
Interval
Map
Normalize
Select
Shift
Sort
Stack
Tree
Window
Interactions
Crosshair
Pointer
Geos
Choropleth
Facets
Horizontal
Vertical
Grid
Showcase
Template
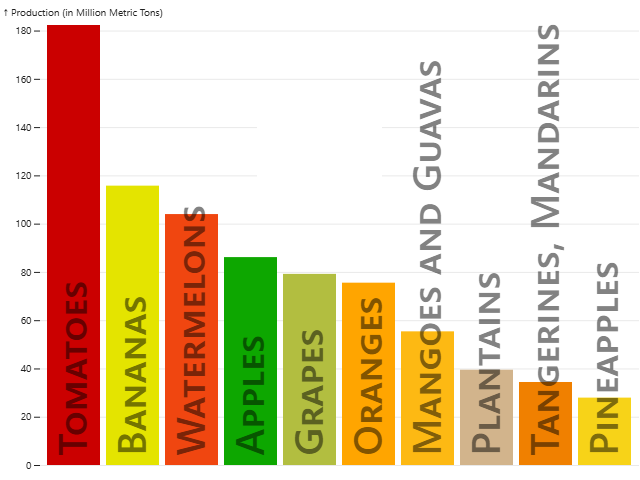
A fruity horizontal bar chart
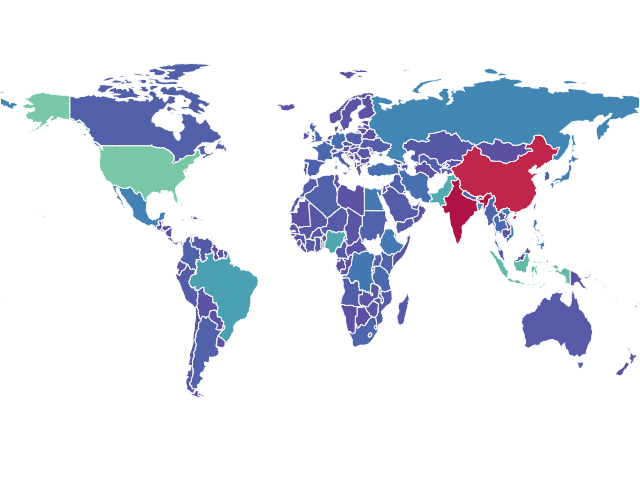
A choropleth map of the world
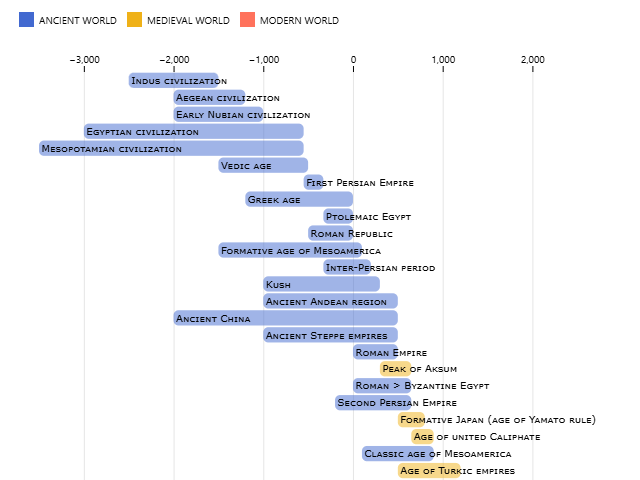
Civilizations
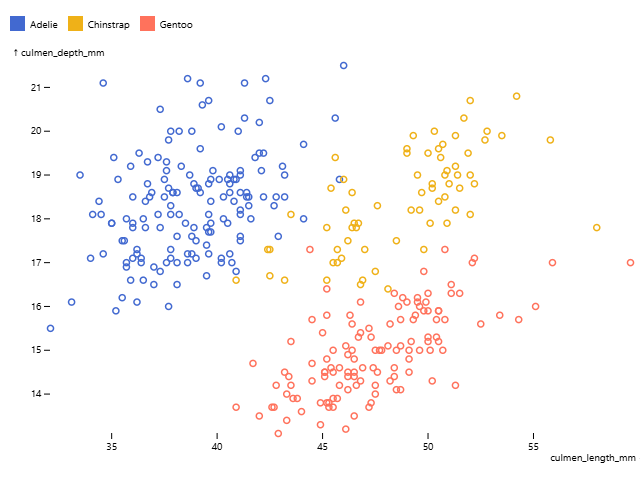
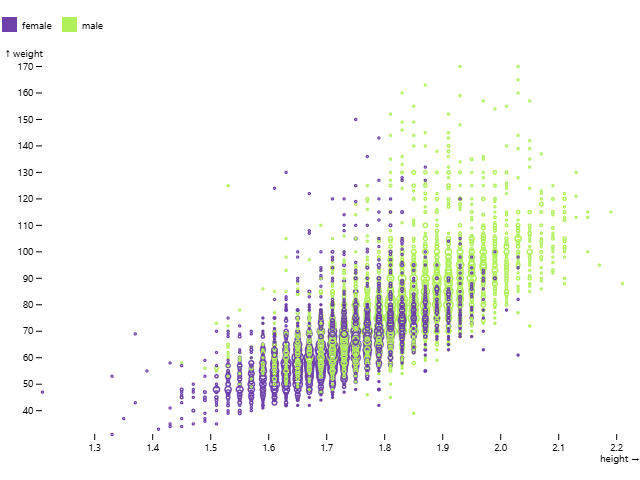
A colored scatterplot
A heatmap of Olympic athletes
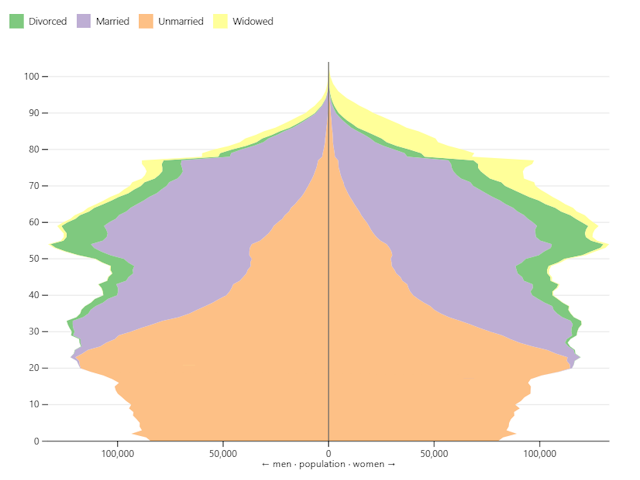
Population pyramid
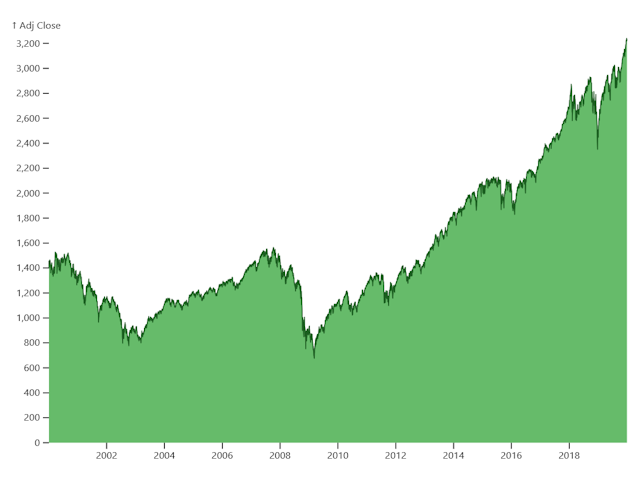
S&P 500 Area Chart
Working with formulas